Data Streams Architecture
High Level Architecture
Chainlink Data Streams has the following core components:
- A Chainlink Decentralized Oracle Network (DON): This DON operates similarly to the DONs that power Chainlink Data Feeds, but the key difference is that it signs and delivers reports to the Chainlink Data Streams Aggregation Network rather than delivering answers onchain directly. This allows the Data Streams DON to deliver reports more frequently for time-sensitive applications. Nodes in the DON retrieve data from many different data providers, reach a consensus about the median price of an asset, sign a report including that data, and deliver the report to the Data Streams Aggregation Network.
- The Chainlink Data Streams Aggregation Network: The Data Streams Aggregation Network stores the signed reports and makes them available for retrieval. The network uses an active-active multi-site deployment to ensure high availability and robust fault tolerance by operating multiple active sites in parallel. The network delivers these reports to Chainlink Automation upon request (Streams Trade) or provide direct access via the API (Streams Direct).
- The Chainlink Verifier Contract: This contract verifies the signature from the DON to cryptographically guarantee that the report has not been altered from the time that the DON reached consensus to the point where you use the data in your application.
Streams Trade Architecture
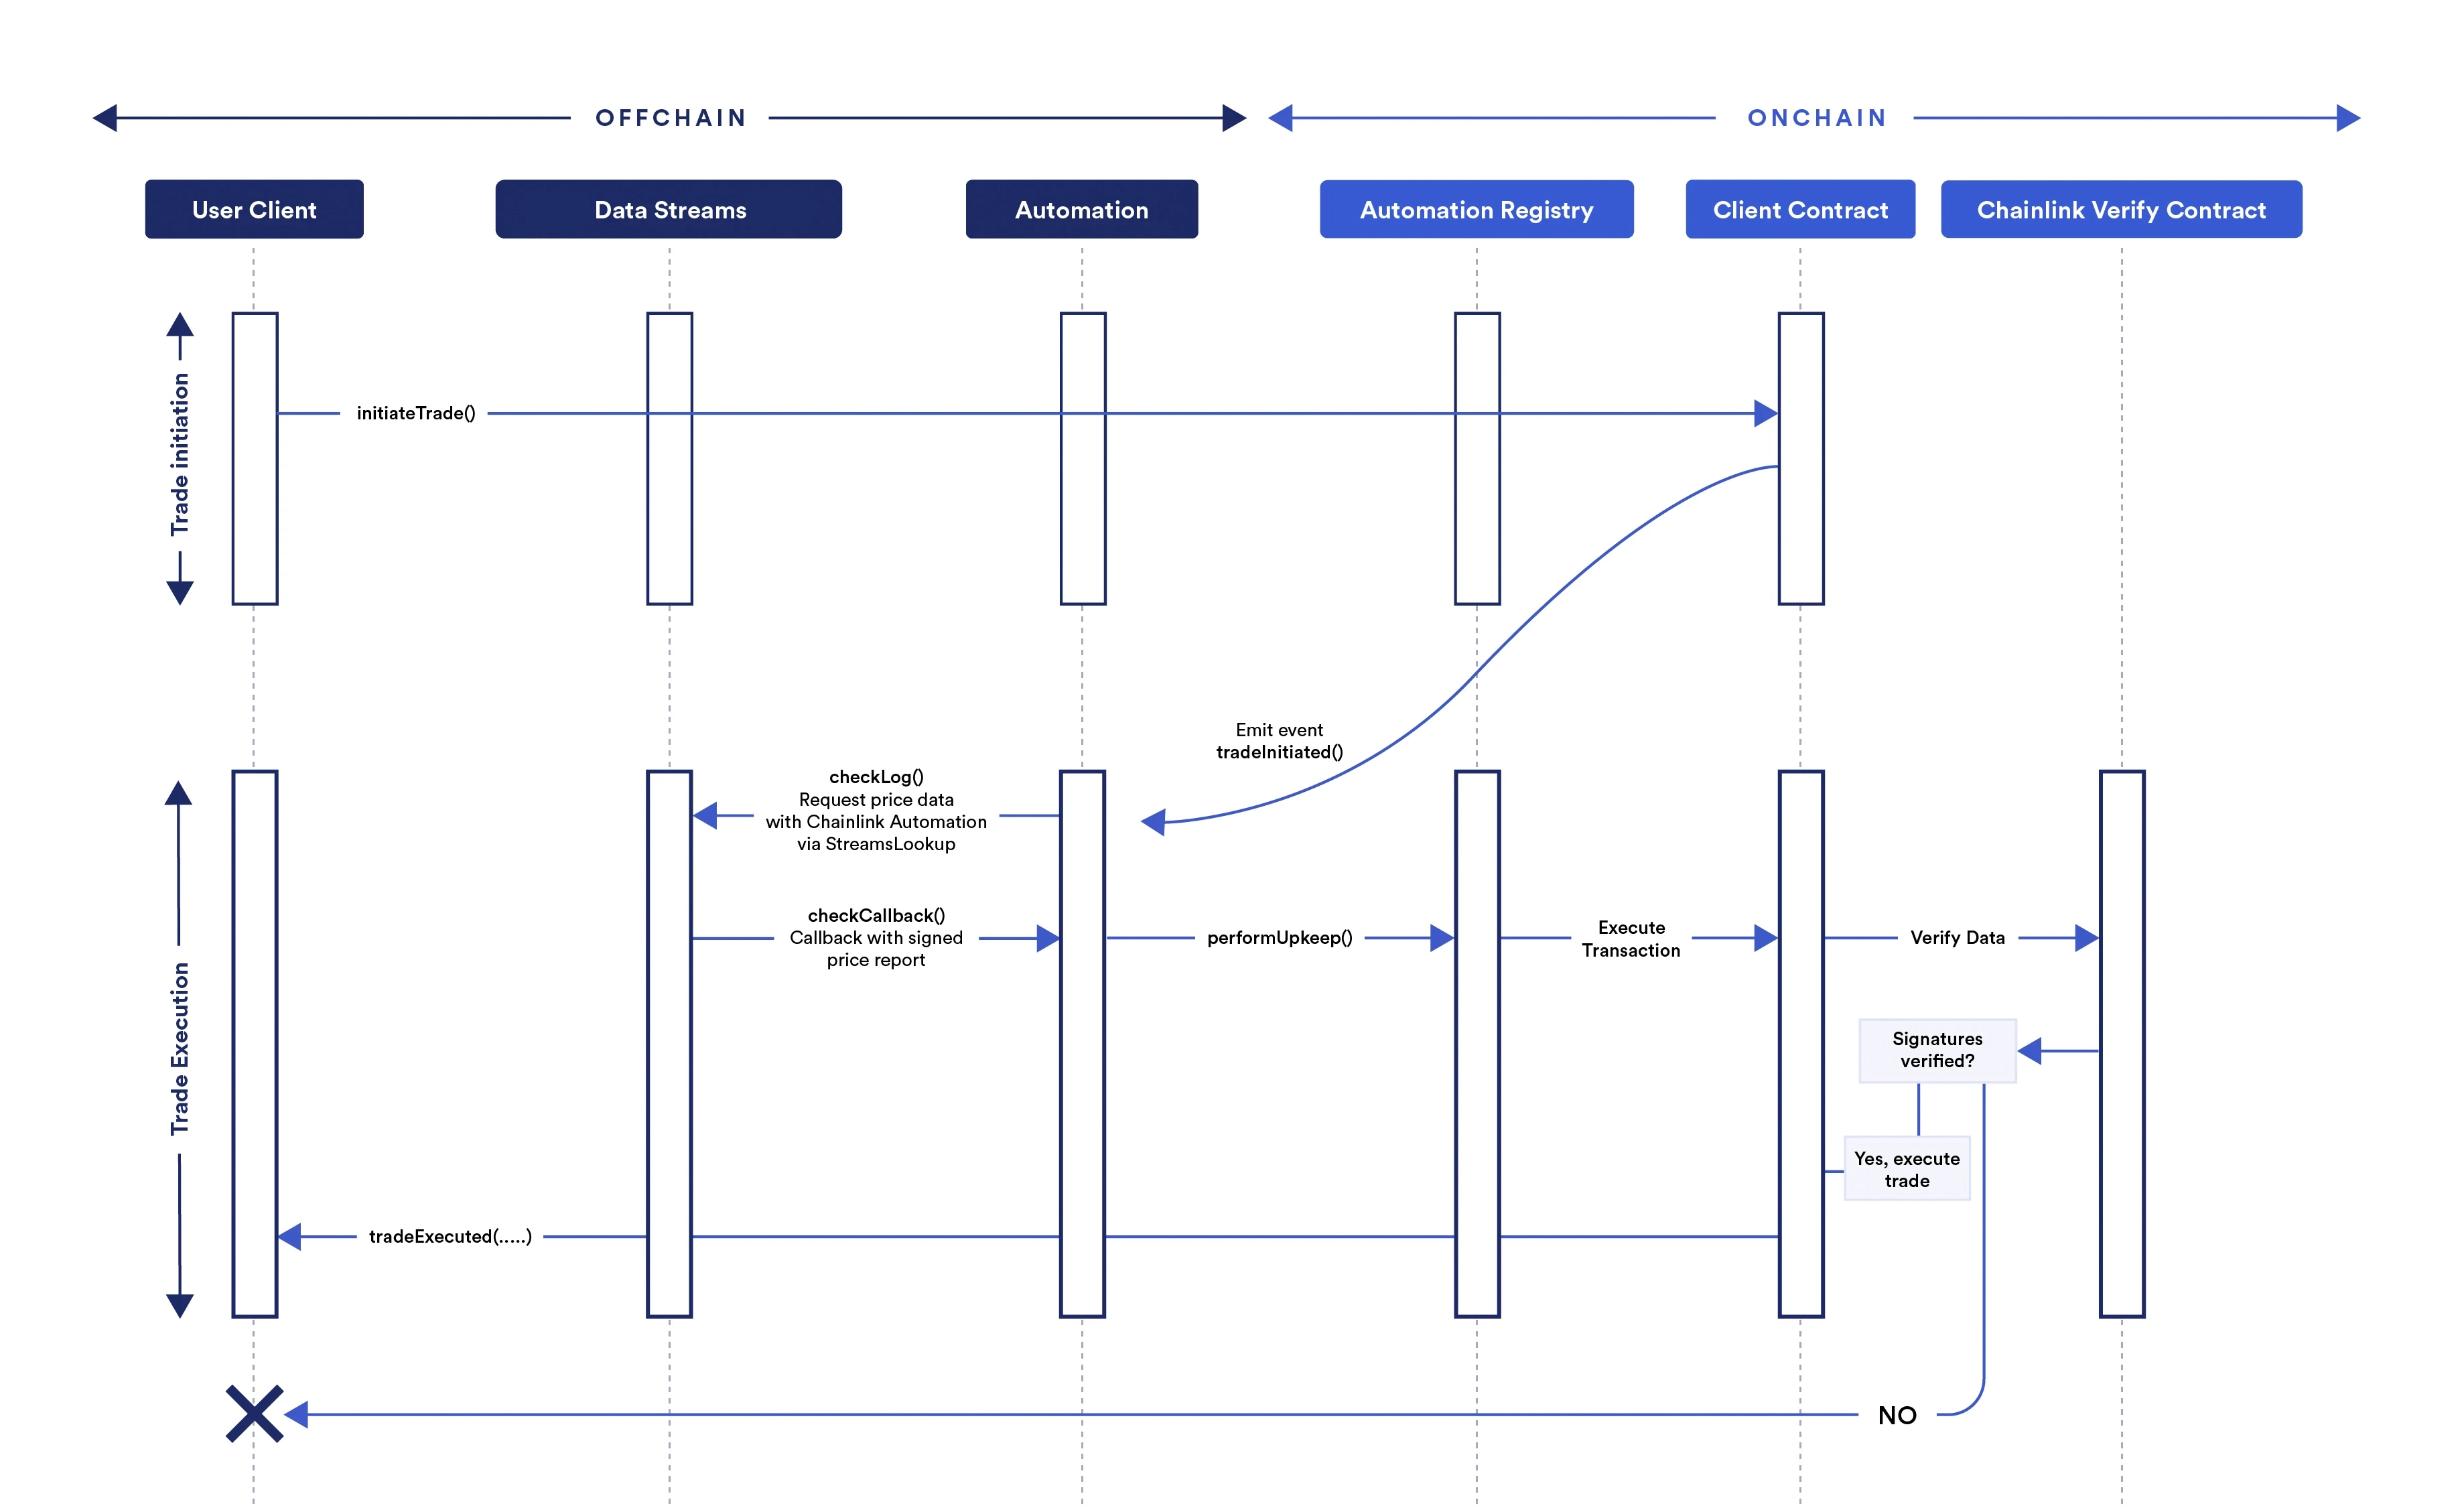
Using Chainlink Automation with Data Streams automates trade execution and mitigates frontrunning by executing the transaction before the data is recorded onchain. Chainlink Automation requests data from the Data Streams Aggregation Network. It executes transactions only in response to the data and the verified report, so the transaction is executed correctly and independently from the decentralized application itself.

Example trading flow using Streams Trade
One example of how to use Data Streams with Automation is in a decentralized exchange. An example flow might work using the following process:

- A user initiates a trade by confirming an
initiateTradetransaction in their wallet. - The onchain contract for the decentralized exchange responds by emitting a log trigger event.
- The Automation upkeep monitors the contract for the event. When Automation detects the event, it runs the
checkLogfunction specified in the upkeep contract. The upkeep is defined by the decentralized exchange. - The
checkLogfunction uses arevertwith a custom error calledStreamsLookup. This approach aligns with EIP-3668 and conveys the required information through the data in therevertcustom error. - Automation monitors the
StreamsLookupcustom error that triggers Data Streams to process the offchain data request. Data Streams then returns the requested signed report in thecheckCallbackfunction for Automation. - Automation passes the report to the Automation Registry, which executes the
performUpkeepfunction defined by the decentralized exchange. The report is included as a variable in theperformUpkeepfunction. - The
performUpkeepfunction calls theverifyfunction on the Data Streams onchain verifier contract and passes the report as a variable. - The verifier contract returns a
verifierResponsebytes value to the upkeep. - If the response indicates that the report is valid, the upkeep executes the user's requested trade. If the response is invalid, the upkeep rejects the trade and notifies the user.
This is one example of how you can combine Data Streams and Automation, but the systems are highly configurable. You can write your own log triggers or custom logic triggers to initiate Automation upkeeps for a various array of events. You can configure the StreamsLookup to retrieve multiple reports. You can configure the performUpkeep function to perform a wide variety of actions using the report.
Read the Getting Started guide to learn how to build your own smart contract that retrieves reports from Data Streams using the Streams Trade implementation.
Streams Direct Architecture
Example of offchain price updates with Streams Direct
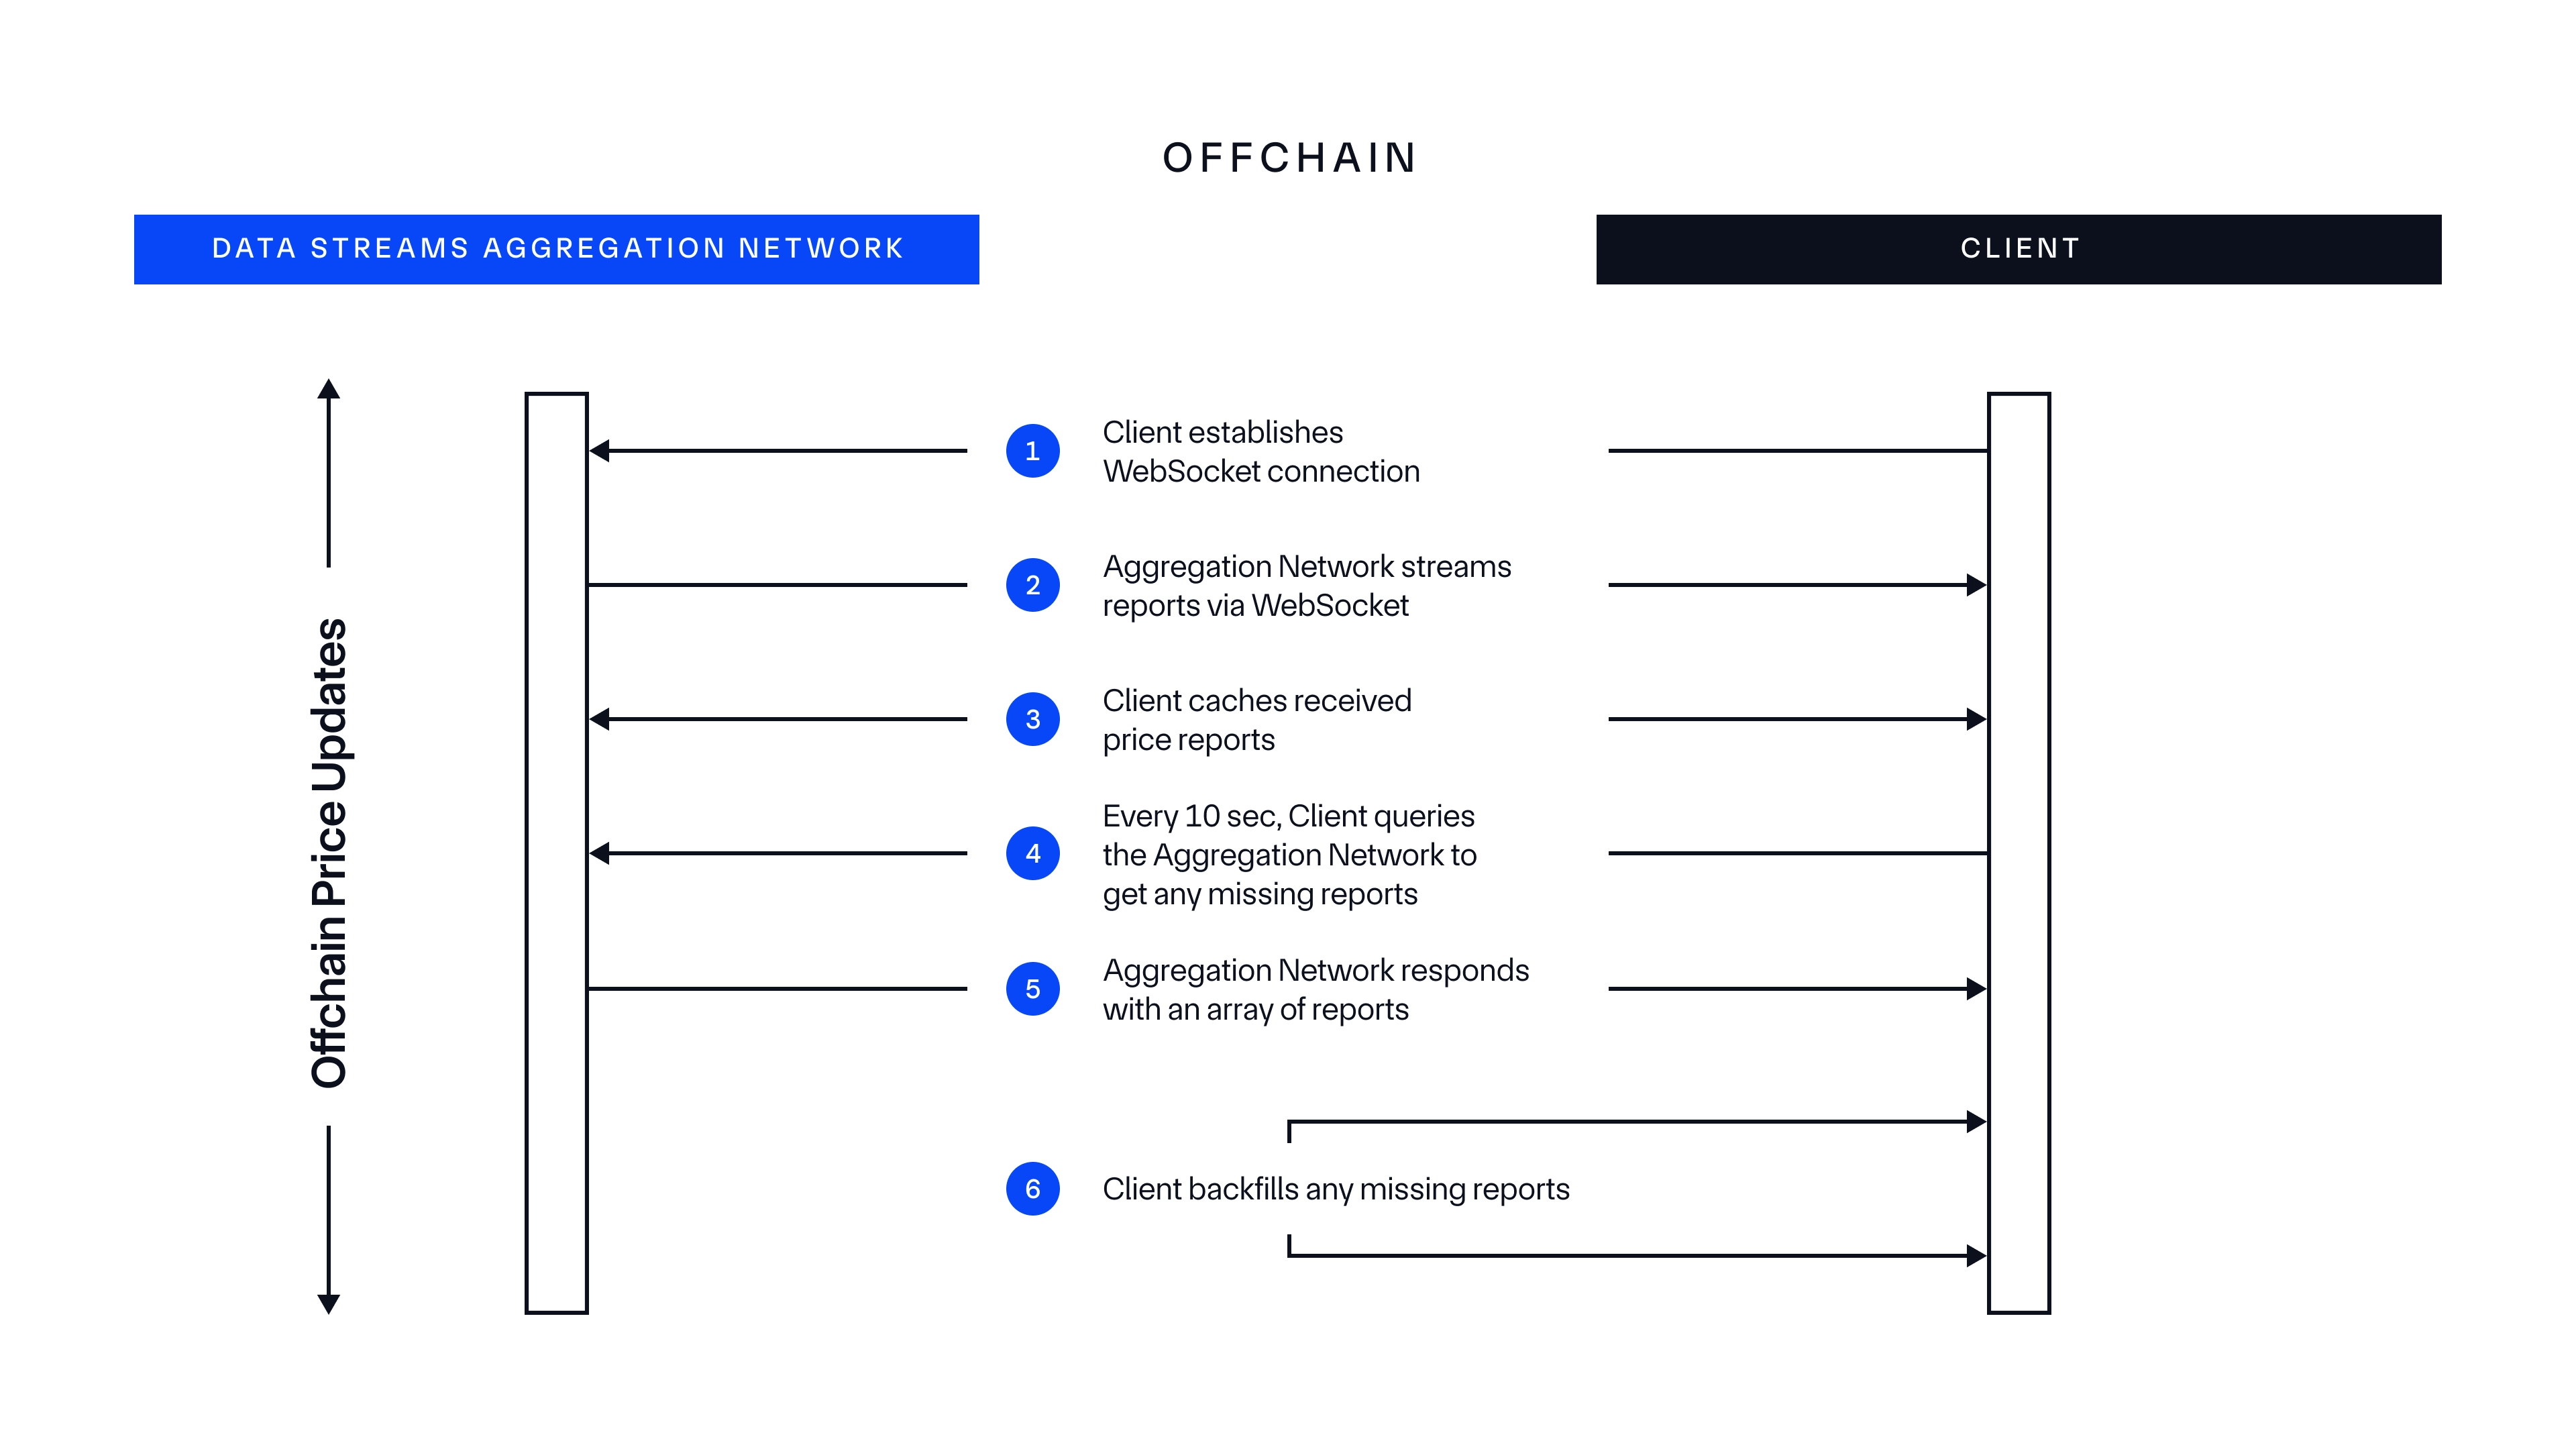
Streams Direct enables seamless offchain price updates through a mechanism designed for real-time data delivery. Here is an example of how your Client will benefit from low-latency market data directly from the Data Streams Aggregation Network.
-
The Client opens a WebSocket connection to the Data Streams Aggregation Network to subscribe to new reports with low latency.
-
The Data Streams Aggregation Network streams price reports via WebSocket, which gives the Client instant access to updated market data.
-
The Client stores the price reports in a cache for quick access and use, which preserves data integrity over time.
-
The Client regularly queries the Data Streams Aggregation Network for any missed reports to ensure data completeness.
-
The Aggregation Network sends back an array of reports to the Client.
-
The Client updates its cache to backfill any missing reports, ensuring the data set remains complete and current.

Active-Active Multi-Site Deployment
Active-active is a system configuration strategy where redundant systems remain active simultaneously to serve requests. Incoming requests are distributed across all active resources and load-balanced to provide high availability, scalability, and fault tolerance. This strategy is the opposite of active-passive where a secondary system remains inactive until the primary system fails.
The Data Streams API services use an active-active setup as a highly available and resilient architecture across multiple distributed and fully isolated origins. This setup ensures that the services are operational even if one origin fails, which provides robust fault tolerance and high availability. This configuration applies to both the REST API and the WebSocket API. A global load balancer seamlessly manages the system to provide automated and transparent failovers. For advanced use cases, the service publishes available origins using HTTP headers, which enables you to interact directly with specific origin locations if necessary.
Active-Active Setup
The API services are deployed across multiple distributed data centers. Each active deployment is fully isolated and capable of handling requests independently. This redundancy ensures that the service can withstand the failure of any single site without interrupting service availability.
Global Load Balancer
A global load balancer sits in front of the distributed deployments. The load balancer directs incoming traffic to the healthiest available site based on real-time health checks and observed load.
- Automated Failover: In the event of a site failure, traffic is seamlessly rerouted to operational sites without user intervention.
- Load Distribution: Requests are balanced across all active sites to optimize resource usage and response times.
Origin Publishing
To enable advanced interactions, the service includes the origin information for all of the available origins in the HTTP headers of API responses. This feature allows customers to explicitly target specific deployments if desired. It also allows for concurrent WebSocket consumption from multiple sites, ensuring fault tolerant WebSocket subscriptions, low-latency, and minimized risk of report gaps.
Example Failover Scenarios
Automatic failover handles availability and traffic routing in the following scenarios:
-
Automatic Failover: If one of the origins becomes unavailable, the global load balancer automatically reroutes traffic to the next available origin. This process is transparent to the user and ensures uninterrupted service. During automatic failover, WebSockets experience a reconnect. Failed REST requests must be retried.
-
Manual Traffic Steering: If you want to bypass the load balancer and target a specific site, you can use the origin headers to direct your requests. This manual targeting does not affect the automated failover capabilities provided by the load balancer, so a request will succeed even if the specified origin is unavailable.
-
Multi-origin concurrent WebSocket subscriptions: In order to maintain a highly available and fault tolerant report stream, you can subscribe to up to two available origins simultaneously. This compares the latest consumed timestamp for each feed and discards duplicate reports before merging the report stream locally.